S-Curve - Definition
- Accounting, Taxation, and Reporting
-
Law, Transactions, & Risk Management
Government, Legal System, Administrative Law, & Constitutional Law Legal Disputes - Civil & Criminal Law Agency Law HR, Employment, Labor, & Discrimination Business Entities, Corporate Governance & Ownership Business Transactions, Antitrust, & Securities Law Real Estate, Personal, & Intellectual Property Commercial Law: Contract, Payments, Security Interests, & Bankruptcy Consumer Protection Insurance & Risk Management Immigration Law Environmental Protection Law Inheritance, Estates, and Trusts
- Marketing, Advertising, Sales & PR
- Business Management & Operations
- Economics, Finance, & Analytics
- Professionalism & Career Development
- Courses
What is an S-Curve?
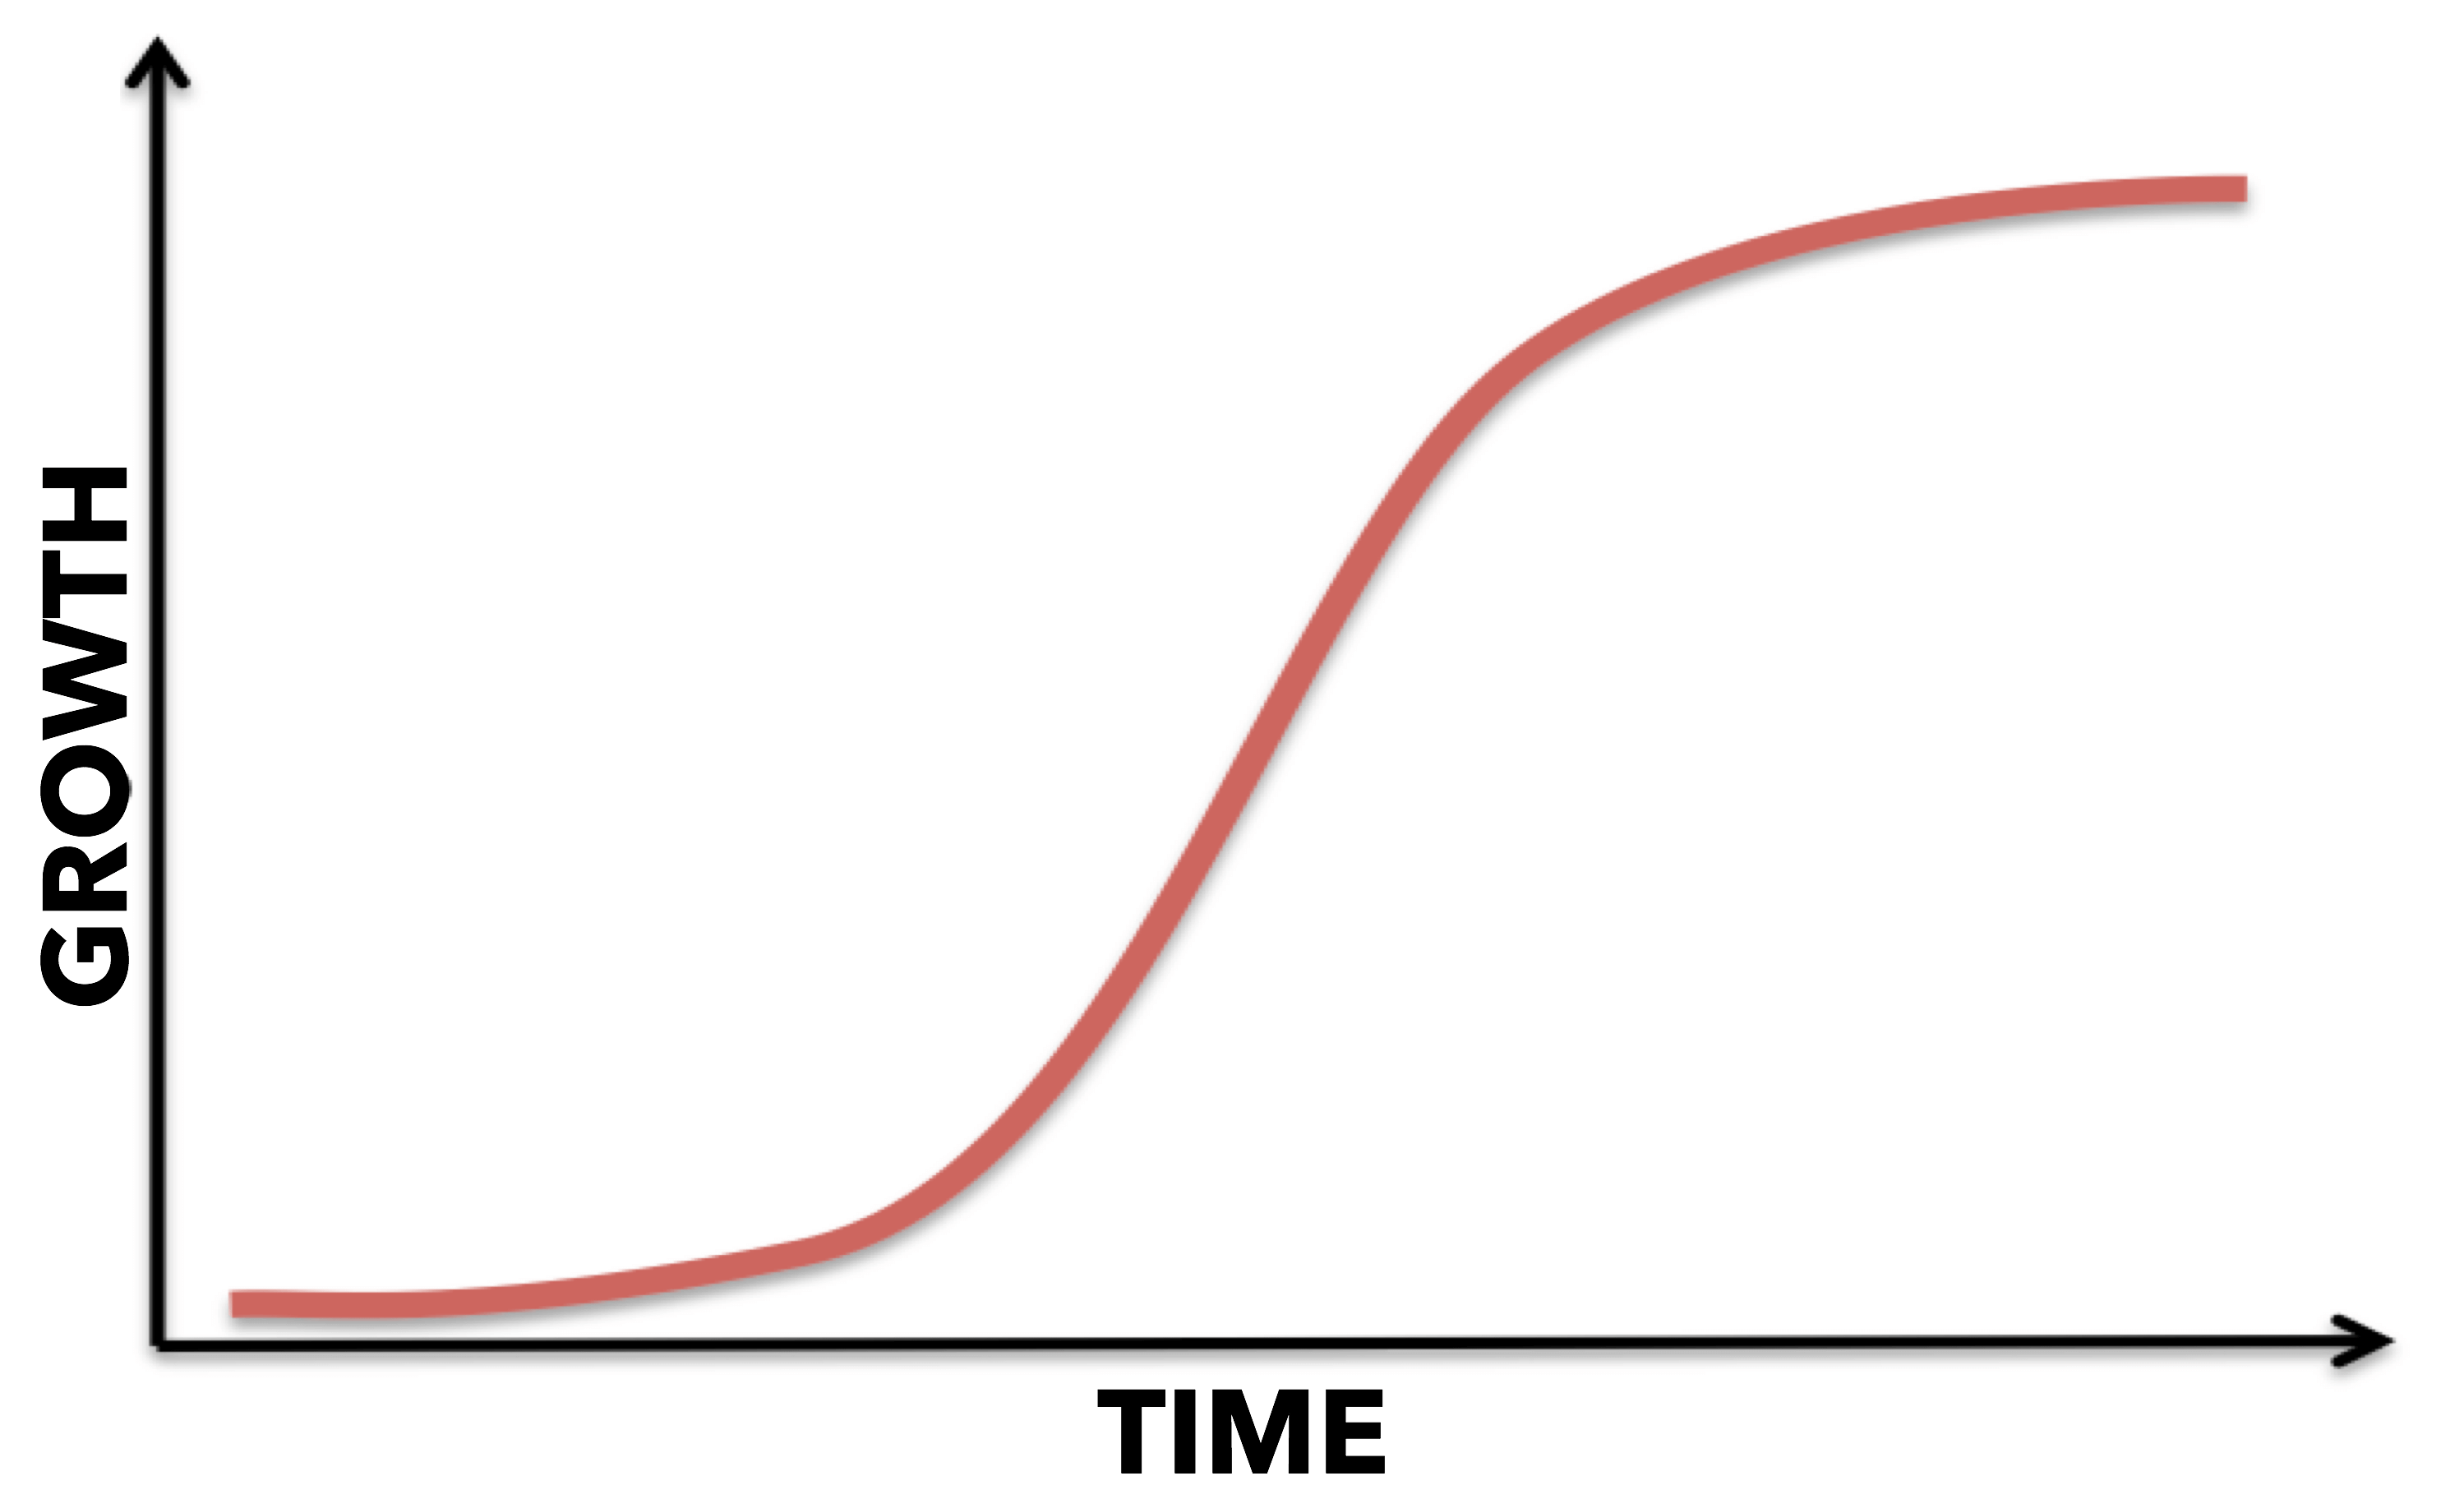
The S curve refers to a chart that is used to describe, visualize, and predict the performance of a project or business overtime. More specifically, it is a logistic curve that plots the progress of a variable by relating it to another variable over time.
The term S curve was developed as a result of the shape that the data takes. Projects on the S curve often experience a slow growth at the beginning, rapid growth in the middle, and slow growth and at the end.
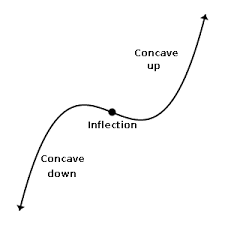
The maximum point of acceleration is called the point of inflexion. It is at this point that the project or business returns to the initial slow growth it started from.
Back to: STRATEGY, ENTREPRENEURSHIP, & INNOVATION
Academic Research on S-Curve
- International diversification and firm performance: The S-curve hypothesis, Lu, J. W., & Beamish, P. W. (2004). International diversification and firm performance: The S-curve hypothesis. Academy of management journal, 47(4), 598-609. A proposed theoretical framework for the study of multinationality and performance includes both benefits and costs of geographic expansion over different phases of internationalization. Data on 1,489 Japanese firms over 12 years show a consistent horizontal X S-shaped X relationship between multinationality and performance. Further, firms investing more heavily in intangible assets, such as technology and advertising, achieved greater profitability gains from growth in foreign direct investment. Our framework and findings highlight complexity and temporal dynamics.
- Dynamics of the Trade Balance and the Terms of Trade: The S-curve, Backus, D., Kehoe, P. J., & Kydland, F. E. (1992). Dynamics of the Trade Balance and the Terms of Trade: The S-curve (No. w4242). National Bureau of Economic Research.
- Exploring the limits of the technology Scurve. Part I: component technologies. Christensen, C. M. (1992). Exploring the limits of the technology Scurve. Part I: component technologies. Production and operations management, 1(4), 334-357. The technology Scurve is a useful framework describing the substitution of new for old technologies at the industry level. In this paper I use information from the technological history of the disk drive industry to examine the usefulness of the Scurve framework for managers at the firm level in planning for new technology development. Because improvements in overall disk drive product performance result from the interaction of improved component technologies and new architectural technologies, each of these must be monitored and managed. This paper focuses on component technology Scurves, and a subsequent paper, also published in this issue of the journal, examines architectural technology Scurves. Improvement in individual components followed Scurve patterns, but I show that the flattening of Scurves is a firmspecific, rather than uniform industry phenomenon. Lack of progress in conventional technologies may be the result, rather than the stimulus, of a forecast that the conventional technology is maturing, and some firms demonstrated the ability to wring far greater levels of performance from existing component technologies than other firms. Attacking entrant firms evidenced a distinct disadvantage versus incumbent firms in developing and using new component technologies. Firms pursuing aggressive Scurve switching strategies in component technology development gained no strategic advantage over firms whose strategies focused on extending the life of established component technologies.
- Manufacturing strategy on the S curve, Skinner, W. (1996). Manufacturing strategy on the S curve. Production and operations management, 5(1), 3-14. The concept and techniques of manufacturing strategy offer managers the opportunity to use their production function as a strategic weapon in competition, an apparently attractive objective. Yet after about 25 years, the use of manufacturing in corporate strategy (MCS) as a management practice is not widespread. In contrast, however, in academic literature it appears to be flourishing and rapidly growing in popularity. This paper seeks to answer this apparent paradox, beginning with the history of MCS as it was developed as a theory of design to enable a manufacturing system to be focused on a key competitive task. Common criticisms of MCS, such as tradeoffs, focus and undynamic, are examined and refuted as valid reasons for its only modest usage. Instead, three new problems in the MCS concept and its techniques are suggested as genuine needs for the completion of the theory and for its becoming more universally understood and used by industrial managers.
- The S-curve relation between per-capita income and insurance penetration, Enz, R. (2000). The S-curve relation between per-capita income and insurance penetration. The Geneva Papers on Risk and Insurance-Issues and Practice, 25(3), 396-406. Models that assume a constant income elasticity of demand for insurance have the unrealistic implication that insurance penetration grows without constraint. This article introduces a logistic function that allows income elasticity to 0vary as the economy matures. Econometric estimations yield a so-called S-curve, for which the income elasticity of demand is equal to one at specific low and high levels of income, but may reach two or more at intermediate income levels. Long-term forecasts for insurance premiums based on GDP projections are possible for countries that either conform to the S-curve model or deviate consistently from it. Analysing deviations from the S-curve allows the identification of outlier countries, in which factors other than GDP drive insurance demand.
- Optimized s-curve motion profiles for minimum residual vibration, Meckl, P. H., & Arestides, P. B. (1998, June). Optimized s-curve motion profiles for minimum residual vibration. In American Control Conference, 1998. Proceedings of the 1998(Vol. 5, pp. 2627-2631). IEEE. A method for developing optimized point-to-point motion profiles to achieve fast motions with minimum vibration is presented. The proposed approach uses the well-known s-curve motion profiles, but optimizes the selection of the ramp-up (and ramp-down) time. The selection of ramp-up time is based on a frequency analysis that minimizes the excitation energy of the input forcing function at the system natural frequency. Simulation results on a lightly-damped system undergoing point-to-point motions demonstrate that the proposed approach decreases residual vibration by almost an order of magnitude over other approaches, even when the actual natural frequency is in error by 10%.
- Exploring the limits of the technology Scurve. Part II: Architectural technologies, Christensen, C. M. (1992). Exploring the limits of the technology Scurve. Part II: Architectural technologies. Production and Operations Management, 1(4), 358-366. This is the second of two papers in which I use information from the technological history of the disk drive industry to examine the usefulness of the Scurve framework for managers at the firm level in planning for new technology development. In this article I show that it is in architectural, rather than component innovation, that entrant firms exhibit an attacker's advantage. A conventionally drawn sequence of intersecting Scurves is a misleading conceptualization of the substitution process for new architectural technologies, because it characterizes architectural innovations strictly in technical terms. Innovations in architectural technologies frequently redefine the functionality of products and address product performance needs in new or remote markets, rather than mainstream ones. Such innovations in architectural technologies entail market innovation as much as technology development, and it is in their ability to aggressively enter emerging or remote markets that entrant firms exhibit an attacker's advantage. I propose a different Scurve framework for processes of architectural technology change that comprehends both its technological and market aspects.
- Working the S-curve: assessing technological threats, Foster, R. N. (1986). Working the S-curve: assessing technological threats. Research Management, 29(4), 17-20.
- Dynamics of the trade balance and the terms of trade in LDCs: The S-curve, Senhadji, A. S. (1998). Dynamics of the trade balance and the terms of trade in LDCs: The S-curve. Journal of International Economics, 46(1), 105-131. In their analysis of the dynamic behavior of terms of trade and the trade balance, Backus, Kehoe, and Kydland found that the lead and lag correlation between these two variables is S-shaped for a set of OECD countries. Furthermore, they show that this S-curve can be replicated by a two-country dynamic general equilibrium model. Surprisingly, the S-curve also describes the dynamic relationship between terms of trade and the trade balance for a large set of LDCs. This S-curve can also be reproduced by a small-open-economy model which captures some important features of LDC economies. The S-curve is unexpectedly robust to variations in the key parameters of the model. The model also captures the business cycle properties of the LDC data.
- An S-curve equation for project control, Miskawi, Z. (1989). An S-curve equation for project control. Construction Management and Economics, 7(2), 115-124. This paper reports a development of an S-curve equation capable of producing an envelope of S-curves. The equation could be used in a variety of applications related to project control in the petro-chemical industry. The research consisted of developing the equation then carrying out various tests; the results show that the theoretical data correlate closely to actual data collected from various petro-chemical projects executed worldwide. The equation is being used in M. W. Kellogg to determine construction S-curves for various projects.
- Putting the S-curve concept to work, Becker, R. H., & Speltz, L. M. (1983). Putting the S-curve concept to work. Research Management, 26(5), 31-33.
- A tool for managing projects: an analytic parameterization of the S-curve, Cioffi, D. F. (2005). A tool for managing projects: an analytic parameterization of the S-curve. International Journal of Project Management, 23(3), 215-222. The solution to a differential equation used frequently in ecology is found to reproduce the well-known S-curve seen in various aspects of project management. The solution is modified in a minor way to fit project management boundary conditions. An excellent fit of this theoretical curve to two samples of project cost data shows the utility of the formula. Numerical approximations valid under typical project conditions are utilized to produce an analytic expression that can easily generate classic project management evolution curves under a variety of conditions. The curves are normalized to two basic parameters: the total of the relevant quantity (e.g., project costs) and the duration of the project. The user can choose the steepness of the climb and the point in time at which half the total has been accumulated.