")
What are the Keynesian Assumptions in the Aggregate Demand and Aggregate Supply Model?
The AD/AS diagram illustrates two Keynesian assumptions—the importance of aggregate demand in causing recession and the stickiness of wages and prices. Note that because of the stickiness of wages and prices, the aggregate supply curve is flatter than either supply curve (labor or specific good). In fact, if wages and prices were so sticky that they did not fall at all, the aggregate supply curve would be completely flat below potential GDP.
This outcome is an important example of a macroeconomic externality, where what happens at the macro level is different from and inferior to what happens at the micro level. For example, a firm should respond to a decrease in demand for its product by cutting its price to increase sales. However, if all firms experience a decrease in demand for their products, sticky prices in the aggregate prevent aggregate demand from rebounding (which we would show as a movement along the AD curve in response to a lower price level).
The original equilibrium of this economy occurs where the aggregate demand function (AD0) intersects with AS. Since this intersection occurs at potential GDP (Yp), the economy is operating at full employment. When aggregate demand shifts to the left, all the adjustment occurs through decreased real GDP. There is no decrease in the price level. Since the equilibrium occurs at Y1, the economy experiences substantial unemployment.
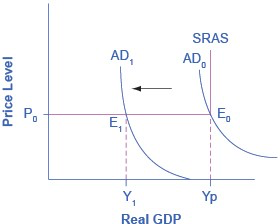
This figure illustrates the two key assumptions behind Keynesian economics. A recession begins when aggregate demand declines from AD0 to AD1. The recession persists because of the assumption of fixed wages and prices, which makes the SRAS flat below potential GDP. If that were not the case, the price level would fall also, raising GDP and limiting the recession. Instead the intersection E1 occurs in the flat portion of the SRAS curve where GDP is less than potential.