Fiscal Policy and the Aggregate Supply and Demand Curve
How does Fiscal Policy Affect the Aggregate Supply and Demand Curve?
- Marketing, Advertising, Sales & PR
- Accounting, Taxation, and Reporting
- Professionalism & Career Development
-
Law, Transactions, & Risk Management
Government, Legal System, Administrative Law, & Constitutional Law Legal Disputes - Civil & Criminal Law Agency Law HR, Employment, Labor, & Discrimination Business Entities, Corporate Governance & Ownership Business Transactions, Antitrust, & Securities Law Real Estate, Personal, & Intellectual Property Commercial Law: Contract, Payments, Security Interests, & Bankruptcy Consumer Protection Insurance & Risk Management Immigration Law Environmental Protection Law Inheritance, Estates, and Trusts
- Business Management & Operations
- Economics, Finance, & Analytics
- Courses
How does Fiscal Policy Affect the Aggregate Supply and Demand Curve?
The result of this is regular shifts to the right of the aggregate supply curves.
The original equilibrium occurs at E0, the intersection of aggregate demand curve AD0 and aggregate supply curve SRAS0, at an output level of 200 and a price level of 90. One year later, aggregate supply has shifted to the right to SRAS1 in the process of long-term economic growth, and aggregate demand has also shifted to the right to AD1, keeping the economy operating at the new level of potential GDP.
The new equilibrium (E1) is an output level of 206 and a price level of 92. One more year later, aggregate supply has again shifted to the right, now to SRAS2, and aggregate demand shifts right as well to AD2. Now the equilibrium is E2, with an output level of 212 and a price level of 94.
In short, the figure shows an economy that is growing steadily year to year, producing at its potential GDP each year, with only small inflationary increases in the price level.
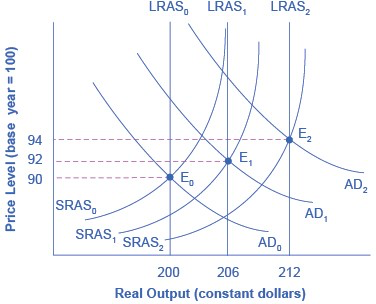
In this well-functioning economy, each year aggregate supply and aggregate demand shift to the right so that the economy proceeds from equilibrium E0 to E1 to E2. Each year, the economy produces at potential GDP with only a small inflationary increase in the price level. However, if aggregate demand does not smoothly shift to the right and match increases in aggregate supply, growth with deflation can develop.
Aggregate demand and aggregate supply do not always move neatly together. Think about what causes shifts in aggregate demand over time. As aggregate supply increases, incomes tend to go up. This tends to increase consumer and investment spending, shifting the aggregate demand curve to the right, but in any given period it may not shift the same amount as aggregate supply. What happens to government spending and taxes?
Government spends to pay for the ordinary business of government- items such as national defense, social security, and healthcare. Tax revenues, in part, pay for these expenditures. The result may be an increase in aggregate demand more than or less than the increase in aggregate supply. Aggregate demand may fail to increase along with aggregate supply, or aggregate demand may even shift left, for a number of possible reasons: households become hesitant about consuming; firms decide against investing as much; or perhaps the demand from other countries for exports diminishes.
Conversely, if shifts in aggregate demand run ahead of increases in aggregate supply, inflationary increases in the price level will result. Business cycles of recession and recovery are the consequence of shifts in aggregate supply and aggregate demand. As these occur, the government may choose to use fiscal policy to address the difference.
Related Topics
- What is Government Spending?
- Autonomous Spending
- Autonomous Consumption
- Fiscal Policy
- Expansionary Fiscal Policy
- Contractionary Fiscal Policy
- Progressive vs Regressive Tax
- Marginal Tax Rates
- Proportional Tax
- Trickle Down Theory
- Discretionary Fiscal Policy
- Automatic Stabilizers
- Effects of Discretionary Policy (Interest Rates & Lags)
- Crowding Out Effect
- National Debt
- Government Borrowing
- Golden Rule
- Ricardian Equivalence
- Balanced Budget - Deficit and Surplus
- National Debt
- Standardized Employment Budget
- Deficit Hawk
- Austerity
- Twin Deficits
- Fiscal Policy and the Aggregate Supply and Demand Curve
- Stabilization Policy
- Robin Hood Effect
- Ricardo Barro Effect
- Automatic Stabilizers
- Standardized Employment Budget
- How Does Fiscal Policy Affect Interest Rates?
- Crowding Out
- Types of Lag in Fiscal Policy
- Temporary and Permanent Fiscal Policy
- Limitations of Fiscal Policy?
- How Politics Affects Discretionary Fiscal Policy
- Government Borrowing
- National Savings and Investment Identity
- Debtor Nation
- Fiscal Policy Affects Trade Balances
- Twin Deficits
- Exchange Rates Affect Budget and Trade Deficits
- What are the risks of chronic large deficits in the United States?
- How Fiscal Policy Can Affect Trade Imbalances
- Government Borrowing Affect Private Savings
- Ricardian Equivalence
- Fiscal Policy Affects Investment and Economic Growth
- Crowding Out of Physical Capital Investment?
- How Does Government Borrowing Affect Interest Rates in Financial Markets?
- Government Investment in Physical Capital
- Public Investment in Human Capital
- Fiscal Policy Can Affect Technology Development
- Economic Cycle or Business Cycle
- Business Cycle Indicator
- Peak and Trough
- Recession and Depression
- Hard Landing vs Soft Landing
- Economic Bubble
- Boom and Bust Cycle
- Great Depression
- Baby Boomer Age Wave Theory
- Skyscrapper Effect (Economics)
- V-Shaped Recovery
- W-Shaped Recovery
- U-Shaped Recovery
- Kondratieff Wave Cycle
- Contagion
- Feedback Rule Policy
- American Customer Satisfaction Index
- CNN Effect
- Bureau of Economic Analysis
- Business Starts Index
- American Recover and Reinvestment Act
- Abenomics
- Emergency Economic Stabilization Act of 2008
- Commodity Credit Corporation
- Humphrey Hawkins Act