Aggregate Expenditure Model - Explained
What is the Aggregate Expenditure Model?
- Marketing, Advertising, Sales & PR
- Accounting, Taxation, and Reporting
- Professionalism & Career Development
-
Law, Transactions, & Risk Management
Government, Legal System, Administrative Law, & Constitutional Law Legal Disputes - Civil & Criminal Law Agency Law HR, Employment, Labor, & Discrimination Business Entities, Corporate Governance & Ownership Business Transactions, Antitrust, & Securities Law Real Estate, Personal, & Intellectual Property Commercial Law: Contract, Payments, Security Interests, & Bankruptcy Consumer Protection Insurance & Risk Management Immigration Law Environmental Protection Law Inheritance, Estates, and Trusts
- Business Management & Operations
- Economics, Finance, & Analytics
- Courses
What is the Aggregate Expenditure Model?
The aggregate expenditure model relates the components of spending (consumption, investment, government purchases, and net exports) to the level of economic activity. In the short run, taking the price level as fixed, the level of spending predicted by the aggregate expenditure model determines the level of economic activity in an economy.
An insight from the circular flow is that real gross domestic product (real GDP) measures three things: the production of firms, the income earned by households, and total spending on firms’ output. The aggregate expenditure model focuses on the relationships between production (GDP) and planned spending:
GDP = planned spending
= consumption + investment + government purchases + net exports.
Planned spending depends on the level of income/production in an economy, for the following reasons:
- If households have higher income, they will increase their spending. (This is captured by the consumption function.)
- Firms are likely to decide that higher levels of production—particularly if they are expected to persist—mean that they should build up their capital stock and should thus increase their investment.
- Higher income means that domestic consumers are likely to spend more on imported goods. Since net exports equal exports minus imports, higher imports means lower net exports.
The negative net export link is not large enough to overcome the other positive links, so we conclude that when income increases, so also does planned expenditure.
The equation of the line is as follows:
spending = autonomous spending + marginal propensity to spend × real GDP.
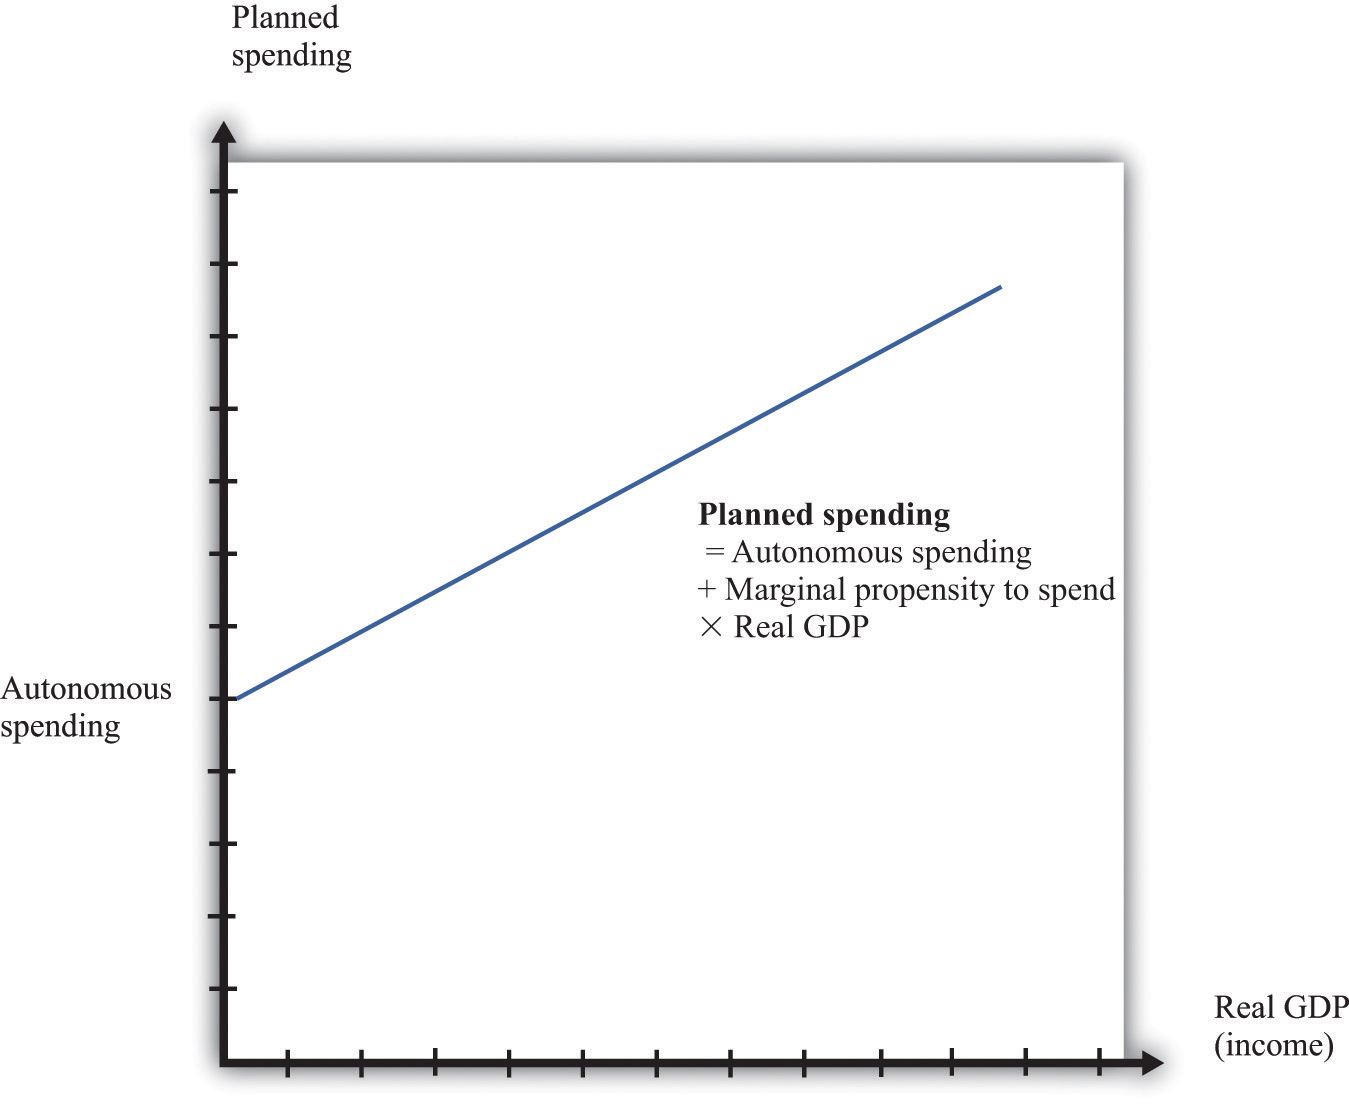
The intercept in is called autonomous spending. It represents the amount of spending that there would be in an economy if income (GDP) were zero.
We expect that this will be positive for two reasons: (1) if a household finds its income is zero, it will still want to consume something, so it will either draw on its existing wealth (past savings) or borrow against future income; and (2) the government would spend money even if GDP were zero.
The slope of the line in is given by the marginal propensity to spend. For the reasons that we have just explained, we expect that this is positive: increases in income lead to increased spending. However, we expect the marginal propensity to spend to be less than one.
The aggregate expenditure model is based on the two equations we have just discussed. We can solve the model either graphically or using algebra.
On the horizontal axis is the level of real GDP. On the vertical axis is the level of spending as well as the level of GDP. There are two lines shown. The first is the 45° line, which equates real GDP on the horizontal axis with real GDP on the vertical axis. The second line is the planned spending line. The intersection of the spending line with the 45° line gives the equilibrium level of output.
Related Topics
- Legal Tender
- Numismatics
- Gresham's Law
- Barter
- Double Coincidence of Wants
- Parity
- Functions of Money
- Medium of Exchange
- Unit of Account
- Store of Value
- Time Value of Money
- Standard of Deferred Payment
- Liquidity Preference Theory
- National Savings and Investment Identity
- Circular Flow of Money
- Commodity Money
- Gold Exchange Standard
- Bretton Woods System
- Fiat Money
- Money Supply
- M1 and M2 Money Supply
- Monetary Base
- Savings, Demand, and Time Deposits
- Banks
- How Do Banks Create Money?
- Financial Intermediary
- Bank Balance Sheet
- Money Multiplier Formula
- Velocity of Money
- Multiplier Effect
- Quantity Equation of Money
- McCallum Rule
- Neutrality of Money
- Real Bills Theory
- Banking System?
- Central Bank
- Federal Reserve System
- Federal Open Market Committee (FOMC)
- Fed Balance Sheet
- Term Auction Facility
- Taylor Rule
- How is the Federal Reserve Bank Organized?
- What is Bank Regulation?
- CAMELS Rating
- FDIC
- CFPB
- Bank Supervision
- Bank Runs
- What is Deposit Insurance?
- Federal Deposit Insurance Corporation
- Lender of Last Resort
- Central Banks Carry Out Monetary Policy
- Open Market Operations
- Bank Reserve
- Discount Rate
- Federal Funds Rate
- Monetary Policy
- Contractionary and Expansionary Monetary Policy
- Loose vs Tight Monetary Policy
- Easy Monetary Policy
- Accommodative Monetary Policy
- Dove & Hawk (Monetary Policy) - Explained
- Tight Monetary Policy - Explained
- Stabilization Policy
- Pushing on a String
- The Effect of Monetary Policy on Interest Rates
- Federal Funds Rate
- Gibson Paradox
- Vasicek Interest Rate Model
- Equation of Exchange (Economics)
- The Effect of Monetary Policy on Aggregate Demand
- Quantitative Easing
- Reserve Currency
- What are Excess Reserves?
- Unpredictable Movements of Velocity
- Central Banks - Unemployment and Inflation
- Inflation Targeting
- Fisher Effect
- Asset Bubbles and Leverage Cycles
- Countercyclical
- Money Capital Market
- Quantity Theory of Money
- Aggregate Expenditure Model
- IS-LM Model
- European Capital Market Institute